Image Details
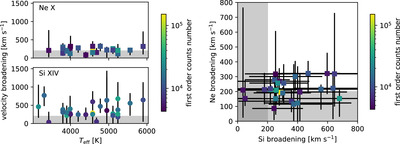
Caption: Figure 12.
The measured line widths from the single line fits. Gray boxes show the regions where the measured line width cannot be distinguished from instrumental broadening alone. Left: velocity broadening vs. effective temperature. The symbol color indicates how far off-axis the source is located, averaged over all observations. Right: comparison of the velocity broadening in Ne and Si directly. The symbol color indicates the number of counts in the zeroth order for each source. An interactive version of this figure is available with the ability to zoom, pan, and display the name and additional information for each source. Clicking on the legend entries mutes/unmutes the data for better visibility. The data necessary to recreate this figure is available in machine-readable format. The data file contains many additional columns which allows readers to also recreate Figures 8–11. An interactive version of this figure is available.
(The data used to create this figure are available.)
An interactive version of this figure is available in the online journal.
Other Images in This Article
Show More
Copyright and Terms & Conditions
© 2024. The Author(s). Published by the American Astronomical Society.