Image Details
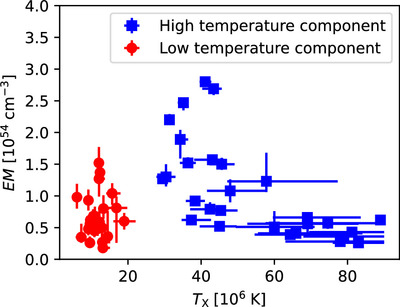
Caption: Figure 11.
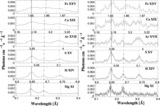
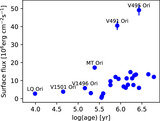
The emission measures from the APED fits plotted vs. the temperatures from the fits. This figure is zoomed in to avoid large values in MT Ori and V450 Ori. An interactive version of this figure is available with the ability to zoom, pan, and display the name and additional information for each source. The data necessary to recreate this figure is available in machine-readable format. The data file contains many additional columns which allows readers to also recreate Figures 8–10 and 12. An interactive version of this figure is available.
(The data used to create this figure are available.)
An interactive version of this figure is available in the online journal.
Other Images in This Article
Show More
Copyright and Terms & Conditions
© 2024. The Author(s). Published by the American Astronomical Society.