Image Details
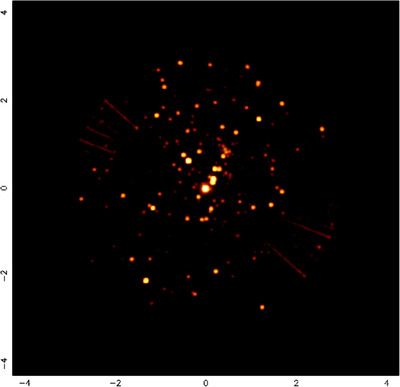
Caption: Figure 3.
Example image of the ONC for approximately 3′ around θ 1 Ori C. This image represents 10% of the exposure time on this field during the 2018–2019 campaign, whereas the associated video includes all of the exposure time on this field. The video is composed of frames with 1 ks of the exposure time in sequential order, organized into a movie to highlight the remarkable short-term variability of the sources in this region. The video runs 16 minutes, 40 s at normal speed. In many cases, a source varies from bright to not detectable in the space of 1 frame (1 ks).
(An animation of this figure is available.)
The video/animation of this figure is available in the online journal.
Other Images in This Article
Show More
Copyright and Terms & Conditions
© 2024. The Author(s). Published by the American Astronomical Society.