Image Details
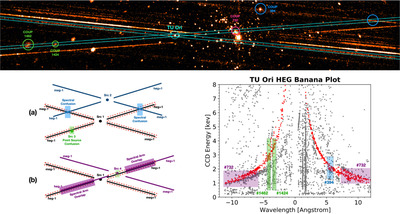
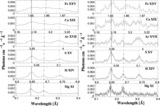
Caption: Figure 2.
Top: an example HETG observation (ObsID 3) demonstrating the need to account for confusion when extracting spectra in the ONC data set. An example dispersed spectrum of TU Ori is displayed (cyan rectangle) with sources of confusion highlighted with circles (green: point source confusion, blue: spectral confusion, magenta: spectral arm overlap). Left: an illustration (not to scale) demonstrating (a) point source (green) and spectral (blue) confusion and (b) spectral arm confusion (magenta). The black X labeled Src 1 corresponds to the source intended for spectral extraction, with the red dashed box corresponding to dispersed events. Specific locations in the extracted spectra where confusion can occur are identified with colored boxes. Right: ACIS order sorting banana plot showing confused events from different sources in the field erroneously being assigned to the spectra of TU Ori. Red dots indicate events that standard CIAO processing assigns to the extracted source (TU Ori), while other events whose CCD-resolved energy does not match the expected wavelength of TU Ori are not included in the standard CIAO source extraction. Colored numbers represent the COUP number of the source causing confusion for this case. Examples where standard CIAO processing has the potential to erroneously include events from other sources in the extracted spectrum of TU Ori are shown as red dots within the colored boxes.
Other Images in This Article
Show More
Copyright and Terms & Conditions
© 2024. The Author(s). Published by the American Astronomical Society.