Image Details
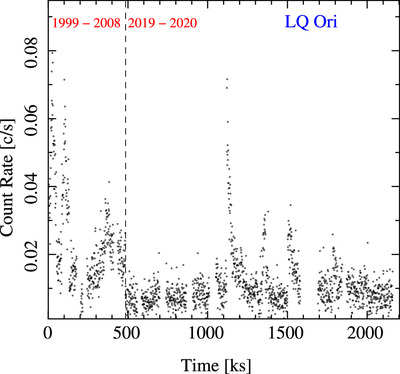
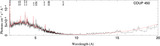
Caption: Figure 4.
Concatenated light curve for LQ Ori observations, each in 1 ks bins. Time on the x-axis is the cumulative observing time since the beginning of the first observation. Data for ObsIDs where confusion affects the zeroth-order count rate have been eliminated in the plot.
Other Images in This Article
Show More
Copyright and Terms & Conditions
© 2024. The Author(s). Published by the American Astronomical Society.
Copyright ©
2025 Astronomy Image Explorer. All Rights Reserved.