Image Details
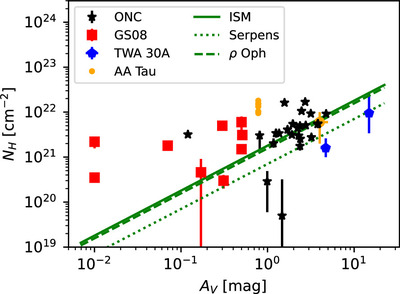
Caption: Figure 9.
The N H from the APED fits plotted vs. the N H determined from optical extinction A V in comparison to AA Tau (the small dots without error bars denote measurements before the dimming) and TWA 30A. The red squares are from the sample from Günther & Schmitt (2008, GS08). Green lines show the N H/A V ratio observed in the ISM and the average value for two other star-forming regions. Data sources are given in Section 4.4.2. Only for AA Tau and TWA 30A extinction and absorption data are contemporaneous, while all other cases rely on optical and X-ray data taken non-contemporaneously. An interactive version of this figure is available with the ability to zoom, pan, and display the name and additional information for each source. Clicking on the legend entries mutes/unmutes the data for better visibility. The data necessary to recreate this figure is available in machine-readable format. The data file contains many additional columns which allows readers to also recreate Figures 8 and 10–12. An interactive version of this figure is available.
(The data used to create this figure are available.)
An interactive version of this figure is available in the online journal.
Other Images in This Article
Show More
Copyright and Terms & Conditions
© 2024. The Author(s). Published by the American Astronomical Society.