Image Details

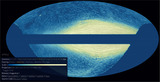
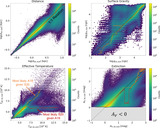
Caption: Figure 12.
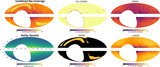
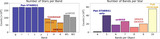
As Figure 11, but now showing the expected distribution of sources from the Galactic prior. These have been normalized so that the total number of sources in each distance bin are the same in both figures. Since the prior contains only smooth components, it does not show any evidence for additional substructure compared to Figure 11. An interactive version of this figure is available in the article and also at https://faun.rc.fas.harvard.edu/czucker/Paper_Figures/brutus_multipanel_toggle.html. An interactive version of Figures 11–14 is available. In this interactive version, the projected sky coverage maps are shown at the top while histograms highlighting wavelength coverage are shown at the bottom. Buttons at the top middle allow the user the ability to see how the coverage changes when including/excluding data from Pan-STARRS1, 2MASS, UKIDSS, and unWISE. Buttons at the top right provide pan, zoom, save, and reset functionality; hover the mouse over each button to see what it does. An interactive version of this figure is available.
An interactive version of this figure is available in the online journal.
Other Images in This Article
Show More
Copyright and Terms & Conditions
© 2024. The Author(s). Published by the American Astronomical Society.