Image Details
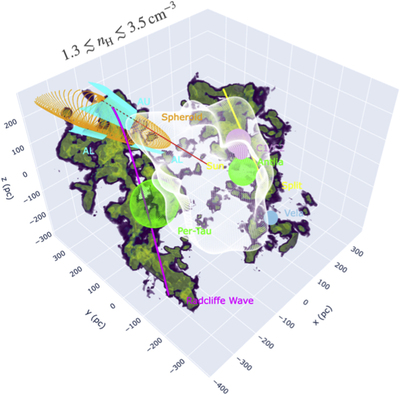
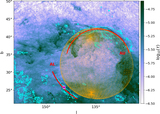
Caption: Figure 11.
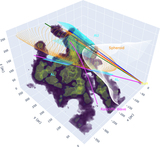
Interactive volume renderings of s x from the entire L20 3D cube, highlighting gas in the limited range of density 1.3 ≲ n H (cm−3) ≲ 3.5 (logarithmic form, see text). For orientation, the path for the extinction density profile toward DF is shown by the red solid line. The white drapery pattern represents the inner surface of the LB (P20). The magenta locus and yellow line show the positions of the best-fit model of the Radcliffe wave (Alves et al. 2020) and the Split (Lallement et al. 2019; Zucker et al. 2022), respectively. The orange spheroid shows an idealized model of the cavity associated with the NCPL. The large green sphere shows the Per-Tau shell (Bialy et al. 2021). The two plum spheres show the H I shells from Bracco et al. (2020). The small green sphere shows the surface of the Antlia supernova remnant (SNR) (Tetzlaff et al. 2013; Jung et al. 2021). The small blue sphere shows the Vela SNR (Dodson et al. 2003).
An interactive version of this figure is available in the online journal.
Other Images in This Article

Show More
Copyright and Terms & Conditions
© 2023. The Author(s). Published by the American Astronomical Society.