Image Details
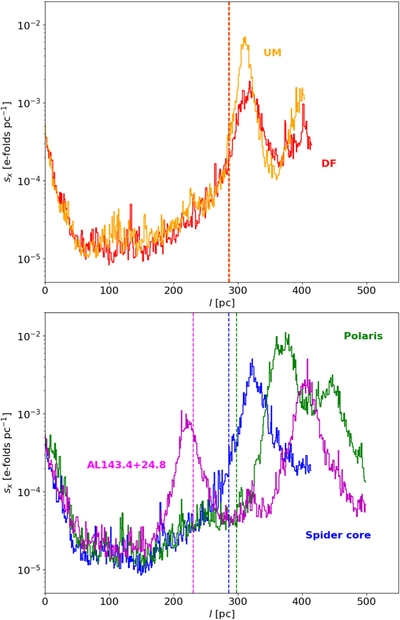
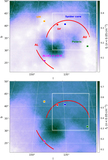
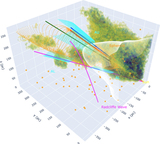
Caption: Figure 4.
G-band extinction density in e-folds per pc along several lines of sight based on the 3D extinction cube from L20. The top panel shows DF and UM lines of sight with H I absorption measurements, and the bottom shows those toward the Spider body, the northern part of Polaris, and AL143.4+24.8. Note that the sharp cuts at large distances are due to the finite coverage of the dust extinction model in the Cartesian cube, which varies with latitude. Vertical lines show the distance to the inner surface of the LB from P20.
Other Images in This Article

Show More
Copyright and Terms & Conditions
© 2023. The Author(s). Published by the American Astronomical Society.
Copyright ©
2025 Astronomy Image Explorer. All Rights Reserved.