Image Details
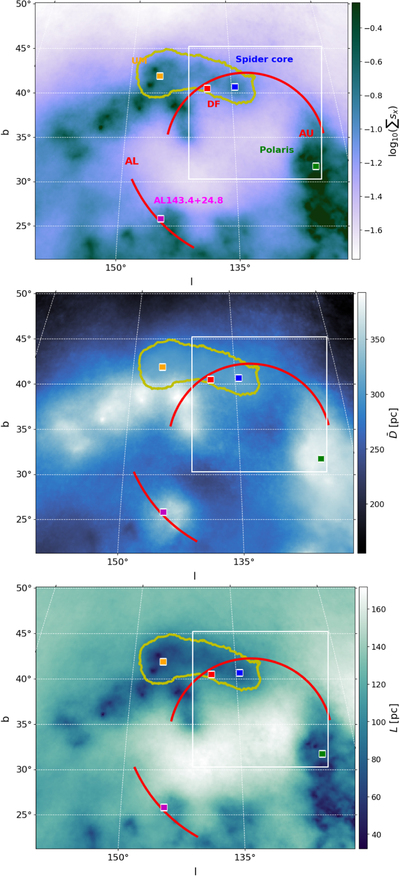
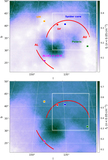
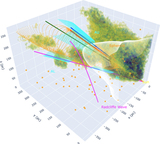
Caption: Figure 3.
Integrated G-band extinction density (top) on a logarithmic scale, distance centroid (middle), and distance dispersion (bottom) from dust extinction profiles in the NCPL from the 3D dust extinction cube from L20. The projection and annotations are as in Figure 1. The orange and red squares show the positions of H I absorption against background radio sources in the UM and DF regions in the DHIGLS survey. The blue, green, and magenta squares show lines of sight toward the Spider body and the northern part of Polaris, and AL143.4+24.8, respectively. The yellow contour at high Galactic latitude shows the coherent structure that includes the Spider and its extension to the east, and that in projection connects to Ursa Major and contributes to what is called the NCPL.
Other Images in This Article

Show More
Copyright and Terms & Conditions
© 2023. The Author(s). Published by the American Astronomical Society.