Image Details
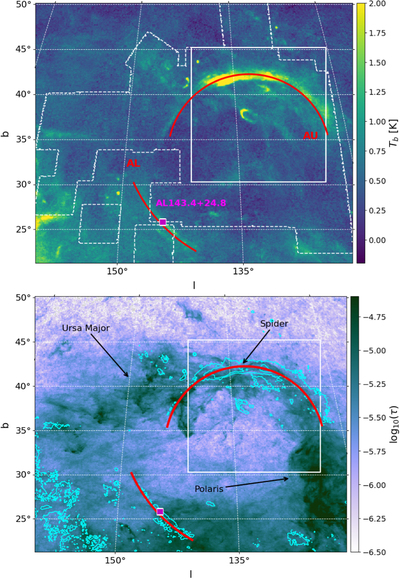
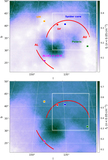
Caption: Figure 1.
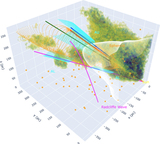
Top: Brightness temperature channel map of the NCPL region from EBHIS data at v = 16.85 km s−1. The white dashed outline shows the coverage of the NCPL mosaic from GHIGLS. The solid white box shows the 15° square region within which T22 analyzed the GHIGLS H I data. Bottom: Dust optical depth map at 353 GHz, τ 353, from Planck Collaboration XI (2014), with 1 K and 2 K contours of the brightness temperature map (top) overlaid in solid cyan. In both panels, red arcs show the location of the moving warm H I gas and the magenta square shows the position of AL143.4+24.8.
Other Images in This Article

Show More
Copyright and Terms & Conditions
© 2023. The Author(s). Published by the American Astronomical Society.
Copyright ©
2025 Astronomy Image Explorer. All Rights Reserved.