Image Details
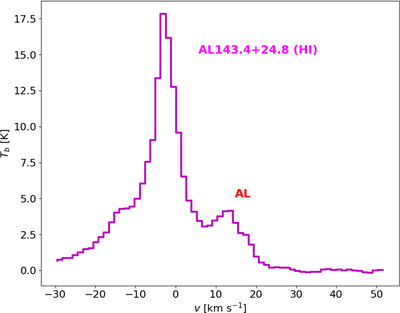
Caption: Figure 2.
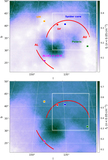
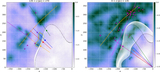
Brightness temperature profile along AL at (143.°4, 24.°8) extracted from the NCPL mosaic in the GHIGLS survey. The emission at positive velocities corresponds to the AL arc seen in the brightness temperature map at v = 16.85 km s−1 shown in the top panel of Figure 1.
Other Images in This Article

Show More
Copyright and Terms & Conditions
© 2023. The Author(s). Published by the American Astronomical Society.
Copyright ©
2025 Astronomy Image Explorer. All Rights Reserved.