Image Details
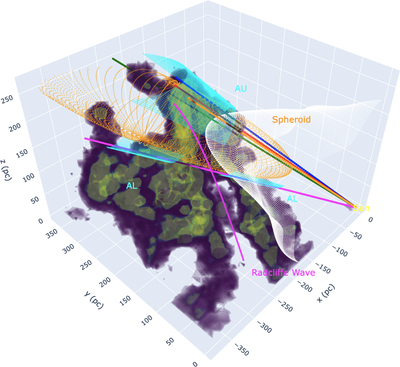
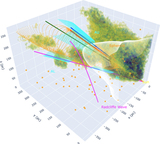
Caption: Figure 7.
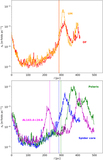
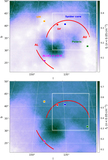
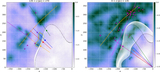
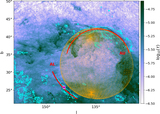
Interactive volume rendering of s x from L20 in the second quadrant above the Galactic plane, highlighting intermediate-density gas (logarithmic form, see text). As in Figure 6, for orientation, projected paths for the extinction density profiles from Figure 4 are shown by color-coded solid lines. The white drapery pattern shows the inner surface of the LB (P20). The magenta curve shows the locus of the best-fit model of the Radcliffe wave (Alves et al. 2020). Cyan short cone segments show AL at 220 ± 50 pc and 410 ± 50 pc. The cyan long cone segment shows AU between the inner surface of the LB and the top layer of the cube. The orange prolate spheroid shows a simplified model of the cavity (see text).
An interactive version of this figure is available in the online journal.
Other Images in This Article

Show More
Copyright and Terms & Conditions
© 2023. The Author(s). Published by the American Astronomical Society.