Image Details
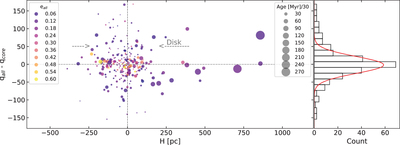
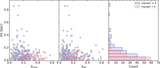
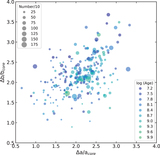
Caption: Figure 9.
The heights (H) from the Galactic disk vs. qall – qcore of the sample clusters (left panel), as well as the histogram of the orientation difference (qall – qcore) of them (right panel). The size of each circle in the left panel indicates the age of a cluster, with its color displaying the overall ellipticities (eall). The vertical dashed line in the left panel represents the Galactic plane, and the horizontal dashed line in this panel indicates the zero stratification degree at the tangential direction of the cluster interior. The red curve in the right panel is the Gaussian fit to the histogram.
Other Images in This Article
Copyright and Terms & Conditions
© 2021. The American Astronomical Society. All rights reserved.
Copyright ©
2026 Astronomy Image Explorer. All Rights Reserved.