Image Details
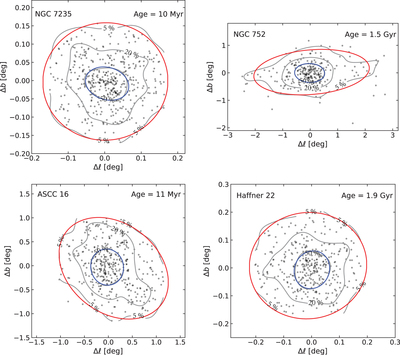
Caption: Figure 1.
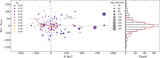
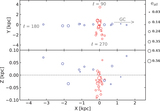
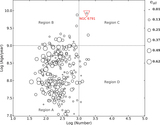
The general scheme of fitting cluster density profiles for four open clusters (NGC 7235, NGC 752, ASCC 16, and Haffner 22). For each cluster in each panel, the black dots represent the member stars of a cluster with the gray lines as the stellar number density profiles at 50% and 5% of the peak. The fitted ellipses of 50% and 5% of the peak stellar number density of the clusters are marked in blue and red, respectively. The percentage labels on the gray lines represent the relative percentage of the actual density value relative to the peak. The density contours at 5% in the panel are incomplete because the cluster member stars show a nondispersive distribution at the periphery of them.
Other Images in This Article
Copyright and Terms & Conditions
© 2021. The American Astronomical Society. All rights reserved.