Image Details
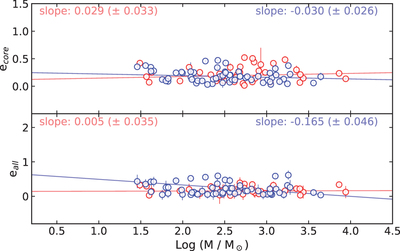
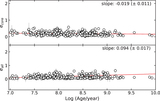
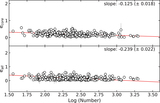
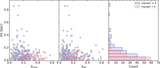
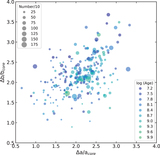
Caption: Figure 6.
The masses vs. the ellipticities (ecore and eall) of 100 clusters in our sample. The subsample is divided into two age groups (log(age/year) < 8 shown as red open circles and log(age/year) ≥ 8 in blue). In each panel, the corresponding linear fits are shown by the red and blue lines, respectively.
Other Images in This Article
Copyright and Terms & Conditions
© 2021. The American Astronomical Society. All rights reserved.
Copyright ©
2026 Astronomy Image Explorer. All Rights Reserved.