Image Details
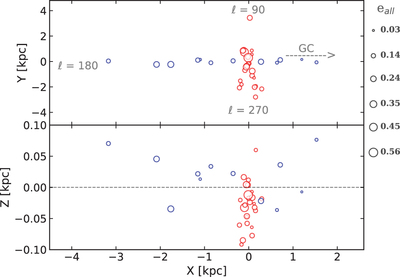
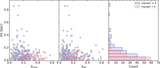
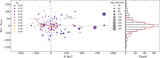
Caption: Figure 10.
The distribution of two subsamples selected from the whole sample in the Galactic disk (X–Y plane, top panel) and the X–Z plane (bottom panel). The red open circles in the top and bottom panels indicate the clusters at the tangential direction (﹩({80}^{\circ }\leqslant l\leqslant {100}^{\circ })﹩ and ﹩({260}^{\circ }\leqslant l\leqslant {280}^{\circ })﹩) within ﹩| Z| ﹩ ﹩\leqslant ﹩ 100 pc, and the blue circles show the clusters at the radial direction (﹩({170}^{\circ }\leqslant l\leqslant {190}^{\circ })﹩ and ﹩({350}^{\circ }\leqslant l\leqslant {10}^{\circ })﹩) within ﹩| Z| ﹩ ﹩\leqslant ﹩ 100 pc. The sizes of the open circles in the two panels are proportional to the overall ellipticities of the subsamples. The black dashed line in the bottom panel represents the Galactic disk. The scales of the circles are shown on the right side of the figure.
Other Images in This Article
Copyright and Terms & Conditions
© 2021. The American Astronomical Society. All rights reserved.