Image Details
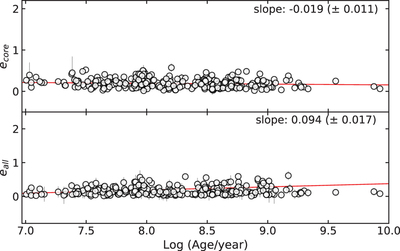
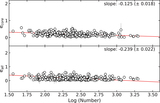
Caption: Figure 4.
The ellipticities (ecore and eall) as a function of the ages of the sample clusters. The inner ellipticities (ecore) are shown in the top panel, and the overall (eall) in the bottom. The gray bars show the errors of the ellipticities. In each panel, the corresponding linear fit is shown as a red line.
Other Images in This Article
Copyright and Terms & Conditions
© 2021. The American Astronomical Society. All rights reserved.
Copyright ©
2026 Astronomy Image Explorer. All Rights Reserved.