Image Details
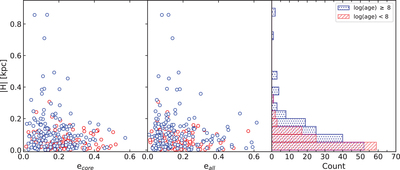
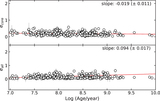
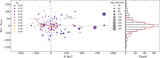
Caption: Figure 7.
The ellipticities (ecore and eall) vs. the heights from the Galactic disk for two age groups from the whole sample (the left and middle panels), and, the histogram of the heights of them (the right panel). The vertical axis of the three panels is the absolute value of the heights. The blue and red circles in the left and the middle panels correspond to clusters with log(age/year) ≥ 8 and log(age/year) < 8, respectively. The red hatched histogram in the right panel corresponds to clusters with log(age/year) < 8 and the blue shadowed histogram for clusters with log(age/year) ≥ 8.
Other Images in This Article
Copyright and Terms & Conditions
© 2021. The American Astronomical Society. All rights reserved.
Copyright ©
2026 Astronomy Image Explorer. All Rights Reserved.