Image Details
Caption: Figure 7.
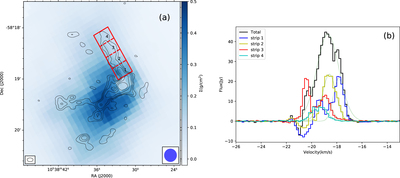
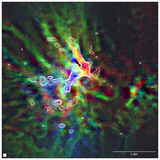
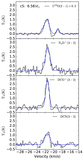
(a) Column density map made with Herchel submillimeter continuum data, overlaid on the 7 m array continuum emission in contours. The contour levels are 1.7 mJy beam−1 × (4, 10, 20, 50, 100). The ALMA synthesized beam is shown in the lower left corner, while the resolution of the Herschel-derived mass surface density map is shown in the lower right corner. The red rectangles dilineate the position of the NE–SW filament and its division into four strips, numbered 1–4 from S to N. (b) C18O(2–1) spectra of the four strips of the NE–SW filament and the total (see legend). The green lines show primary Gaussian component fits to these spectra.
Other Images in This Article

Show More
Copyright and Terms & Conditions
© 2020. The American Astronomical Society. All rights reserved.