Image Details
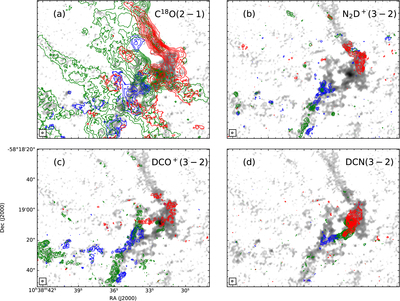
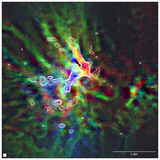
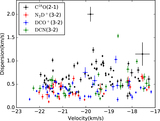
Caption: Figure 8.
(a) C18O integrated intensity map using combined 7 m+12 m array data. Red, green, and blue contours show emission integrated from −23 to −21, −21 to 19, and −19 to −17 km s−1, respectively. The contours start from 4σ in steps of 2σ, with σ = 0.1 Jy beam−1 km s−1. The gray-scale image is the 1.″0 resolution 7 m+12 m array combined 1.3 mm continuum image. (b) Same as panel (a) but for ﹩{{\rm{N}}}_{2}{{\rm{D}}}^{+}﹩(3–2). The contours start from 4σ in steps of 2σ, with σ = 0.025 Jy beam−1 km s−1. (c) Same as panel (a) but for ﹩{\mathrm{DCO}}^{+}﹩(3–2). The contours start from 4σ in steps of 2σ, with σ = 0.03 Jy beam−1 km s−1. (d) Same as panel (a) but for ﹩\mathrm{DCN}﹩(3–2). The contours start from 4σ in steps of 2σ, with σ = 0.03 Jy beam−1 km s−1.
Other Images in This Article

Show More
Copyright and Terms & Conditions
© 2020. The American Astronomical Society. All rights reserved.