Image Details
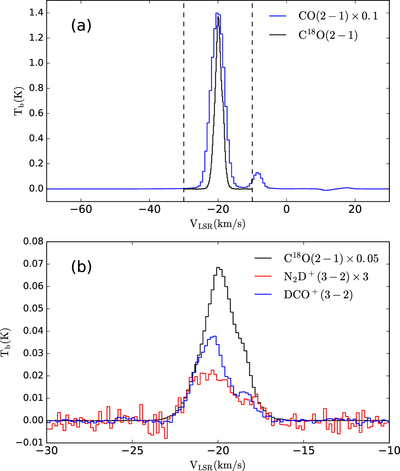
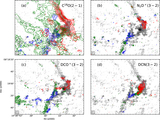
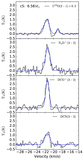
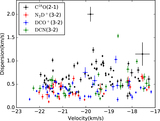
Caption: Figure 2.
(a) Averaged CO(2–1) and C18O(2–1) TP spectra extracted over a 2.′5 radius aperture centered on the phase center. Note that the flux scale of CO(2–1) has been reduced by a factor of 10. (b) Same as (a) but for C18O(2–1), ﹩{{\rm{N}}}_{2}{{\rm{D}}}^{+}﹩(3–2), and ﹩{\mathrm{DCO}}^{+}﹩(3–2) in a smaller velocity range from −30 to −10 km s−1. The flux scale of C18O(2–1) is reduced by a factor of 20 and that of ﹩{{\rm{N}}}_{2}{{\rm{D}}}^{+}﹩(3–2) is increased by a factor of 3 for ease of comparison. Note that the ﹩{{\rm{N}}}_{2}{{\rm{D}}}^{+}﹩(3–2) emission is affected by hyperfine structure, while ﹩{\mathrm{DCO}}^{+}﹩(3–2) is not.
Other Images in This Article
Show More
Copyright and Terms & Conditions
© 2020. The American Astronomical Society. All rights reserved.