Image Details
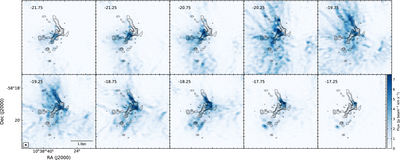
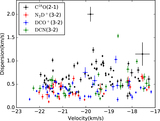
Caption: Figure 6.
The 7 m C18O(2–1) emission integrated over 0.5 km s−1 intervals, as indicated in the upper left corner of each panel, from −22.0 to −17.0 km s−1. The black contours show the 7 m array 1.3 mm continuum emission. The contour levels are 1.7 mJy beam−1 × (4, 10, 20, 50, 100).
Other Images in This Article

Show More
Copyright and Terms & Conditions
© 2020. The American Astronomical Society. All rights reserved.
Copyright ©
2025 Astronomy Image Explorer. All Rights Reserved.