Image Details
Caption: Figure 3.
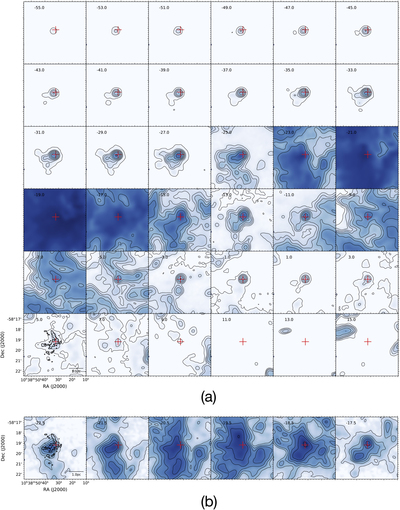
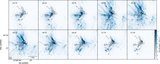
(a) Channel maps of TP CO(2–1) emission integrated over every 2.0 km s−1, as indicated in the upper left corner of each panel (indicating the central velocity of the range), from −55.0 to +15.0 km s−1. The contour levels are 1 Jy beam−1 km s−1 × (1, 5, 10, 20, 40, 80, 200). The red plus sign in each panel marks the phase center of the observation (R.A. = 10:38:33, decl. = −58:19:22). The thick black contour in the lower left panel shows the 4σ level of the 7 m continuum emission. (b) Channel maps of TP C18O(2–1) emission integrated over every 1.0 km s−1, with ranges from −22.5 to −17.5 km s−1. The contour levels are 1 Jy beam−1 km s−1 × (1, 5, 10, 20, 40, 80, 200). The thick black contour in the left panel shows the 4σ level of the 7 m continuum emission.
Other Images in This Article

Show More
Copyright and Terms & Conditions
© 2020. The American Astronomical Society. All rights reserved.