Image Details
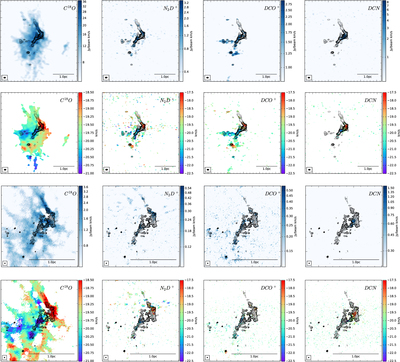
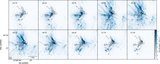
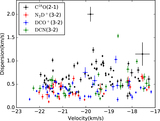
Caption: Figure 4.
Summary figure for the 7 and 12 m line observations. Columns from left to right show the results of C18O(2–1), ﹩{{\rm{N}}}_{2}{{\rm{D}}}^{+}﹩(3–2), ﹩{\mathrm{DCO}}^{+}﹩(3–2), and ﹩\mathrm{DCN}﹩(3–2). From top to bottom, the color scales show the maps of 7 m moment 0, 7 m moment 1, 7 m+12 m moment 0, and 7 m+12 m moment 1. The color bar on the right indicates the flux scale in Jy beam−1 for moment 0 maps and velocity in km s−1 for moment 1 maps. The black contours illustrate the 1.3 mm continuum emission for comparision, with the first two rows showing 7 m continuum images and the last two rows 7 m+12 m images.
Other Images in This Article

Show More
Copyright and Terms & Conditions
© 2020. The American Astronomical Society. All rights reserved.