Image Details
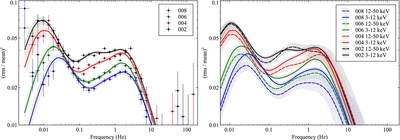
Caption: Figure 7.
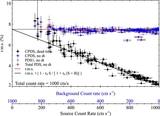
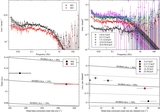
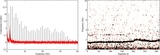
GX 339−4: cospectra for the four pointings, in the 3–50 energy band (left) and in two energy bands (right). Best-fit models with three zero-centered Lorentzian components are also plotted. In the second plot, only the best-fit models are plotted for clarity. There is a clear evolution of the cospectrum: first of all, the rms generally decreases as the outburst goes on; the Lorentzians, in particular below 1 Hz, generally increase their widths; also, while the two energy bands have the same cospectrum in the first observation, they separate more and more clearly in the following ones. We verified that this change is too strong to be produced by dead time alone (it can account for at most a 10% relative rms drop). In the latest two observations a hint of a power-law component below 0.01 Hz also appears. It is not significant in our fits.
Other Images in This Article

Copyright and Terms & Conditions
© 2015. The American Astronomical Society. All rights reserved.