Image Details
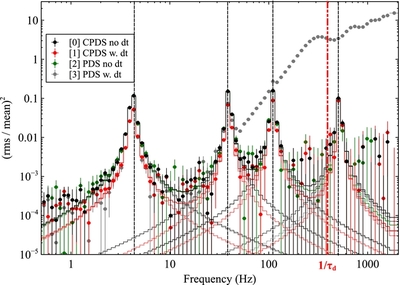
Caption: Figure 2.
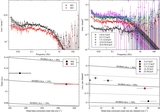
QPOs of equal Q factor (20) and rms amplitude (8%) at different frequencies. The units in this plot, and in all following power spectra or cospectra, if not stated otherwise, are power×frequency. Gray points show the standard, dead-time-affected PDS. The white noise level to subtract in the dead-time-affected data sets was calculated between 10 and 20 Hz (minimum between two QPOs), while in the dead-time-free case we subtracted the theoretical level (2 in Leahy normalization).
Other Images in This Article

Copyright and Terms & Conditions
© 2015. The American Astronomical Society. All rights reserved.
Copyright ©
2026 Astronomy Image Explorer. All Rights Reserved.