Image Details
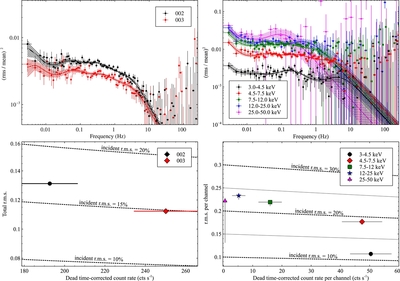
Caption: Figure 6.
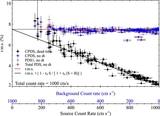
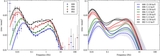
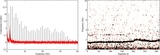
Cyg X-1: Top left: comparison of the cospectrum in the two ObsIDs; both observations are fitted with a model composed of four zero-centered Lorentzians. Top right: cospectra in different energy ranges, fitted with four Lorentzians (except the highest energy range, fitted with two Lorentzians). There is a clear change of the cospectrum with energy, with a quasi-monotonic increase of rms. The cutoff frequency is consistent with being stable. Hatched regions represent the 90% errors (Δχ2 = 2.706) on the best-fit model for each energy range. Bottom left: change of total rms in Cyg X-1 between the two observations. The points give the measured rms, and the dashed lines show a grid of dead-time-corrected rms values, following the methods shown in Figure 4. Bottom right: change of rms at different energies in Obs. 002. The rms error bars are smaller than the marker size in most cases.
Other Images in This Article

Copyright and Terms & Conditions
© 2015. The American Astronomical Society. All rights reserved.