Image Details
Caption: Figure 1.
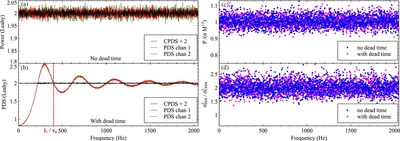
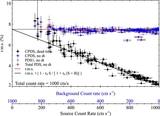
Left: the cospectrum and the PDS are compared in the case of pure Poisson noise, without (a) and with (b) dead time. The simulated incident count rate was 225 cts s−1. The cospectrum mean is always zero. In these plots, it has been increased by two for display purposes. The frequency 1/τd is indicated. Right: the usual relation between the PDS and its standard deviation ( , where M is the number of averaged PDSs) holds with and without dead time (c). Also, the variance of the cospectrum is half the variance of the PDS, in both cases (d).
Other Images in This Article
Copyright and Terms & Conditions
© 2015. The American Astronomical Society. All rights reserved.
Copyright ©
2026 Astronomy Image Explorer. All Rights Reserved.