Image Details
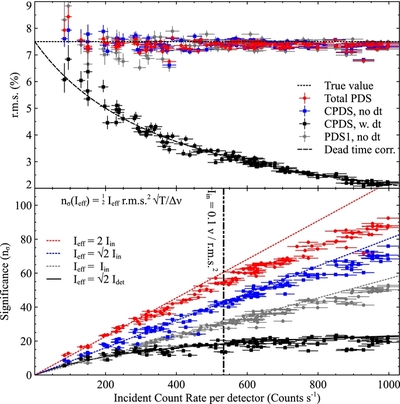
Caption: Figure 4.
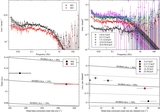
Similar to Figure 3, but with the centroid frequency of the QPO fixed at 30 Hz and letting the count rate vary between 10 and 1000 counts s−1. A total of 118 simulations were used in this plot. The line shows Equation (5). It is not a fit, and describes the data remarkably well. In the bottom panel, we plot the detection significance for all the cases. The lines, again, are not fitted, they only show the theoretical prediction from Equation (4). All dead-time-free cases are in good agreement with a linear increase with count rate below ~500counts s−1, above which some curvature appears due to the departure from the quasi-Poissonian regime. The dead-time-affected case is in good agreement with Equation (4) if, instead of the incident count rate (dashed line), one uses the observed count rate (solid line; see Equation (5)).
Other Images in This Article

Copyright and Terms & Conditions
© 2015. The American Astronomical Society. All rights reserved.