Image Details

Caption: Figure 3.
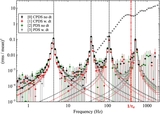
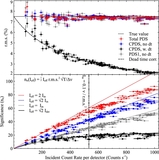
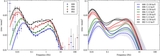
Top: variation of the rms of a QPO at different peak frequencies, measured with the various techniques and with and without dead time. Each point represents a simulated QPO with rms = 10% and FWHM = 2 Hz. A total of 281 simulations were used for this plot. (Bottom) Significance measured with each method. The total PDS has about twice the significance of the single-module PDS in the no-dead-time case, as expected, owing to double the number of photons. The CPDS in the no-dead-time case is a factor of  higher than the single PDS, and lower than the total PDS by the same amount. The dead-time-affected CPDS, instead, has a much lower level due to the lack of photons. The decrease of significance does not depend on the frequency of the QPO, but only on count rate (see Figure 4).
Other Images in This Article

Copyright and Terms & Conditions
© 2015. The American Astronomical Society. All rights reserved.