Image Details
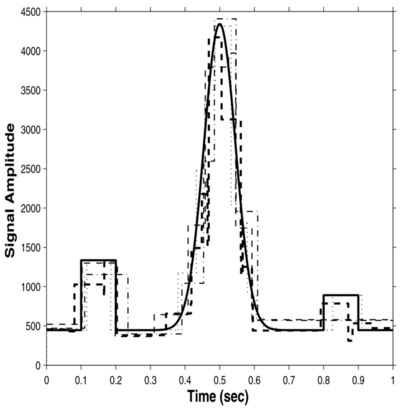
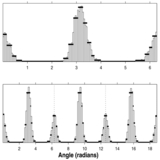
Caption: Figure 9.
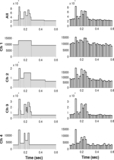
Multivariate analysis of synthetic signal consisting of two blocks surrounding a Gaussian shape centered on the interval [0, 1] (solid line). Optimal blocks for three independent data series drawn randomly from the probability distribution corresponding to this signal are thin lines: 1024 event times (dash), 4096 events in 32 bins (dot-dash), and 32 random amplitudes normally distributed with mean equal to the signal at random times uniformly distributed on [0, 1] and constant variance (dots). The thicker dashed line is the combined analysis of all three.
Other Images in This Article

Show More
Copyright and Terms & Conditions
© 2013. The American Astronomical Society. All rights reserved.
Copyright ©
2025 Astronomy Image Explorer. All Rights Reserved.