Image Details
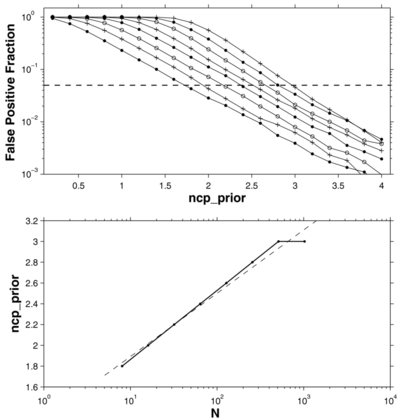
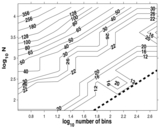
Caption: Figure 6.
Simulations of point measurements (Gaussian noise with signal-to-noise ratio of 10) to determine ﹩\mbox{ncp}\_\mbox{prior} = -\log (\gamma)﹩. Top: false positive fraction p0 vs. value of ﹩\mbox{ncp}\_\mbox{prior}﹩ with separate curves for the values N = 8, 16, 32, 64, 128, 256, 512, and 1024 (left to right; alternating dots, + and circles). The points at which the rate becomes unacceptable (here 0.05; dashed line) determines the recommended values of ﹩\mbox{ncp}\_\mbox{prior}﹩ shown as a function of N in the bottom panel.
Other Images in This Article

Show More
Copyright and Terms & Conditions
© 2013. The American Astronomical Society. All rights reserved.
Copyright ©
2025 Astronomy Image Explorer. All Rights Reserved.