Image Details
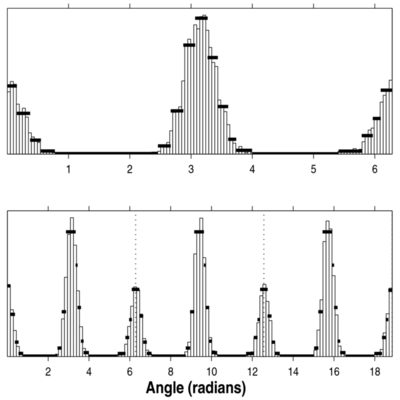
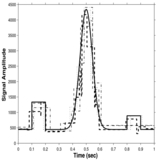
Caption: Figure 10.
Data on the circle: events drawn from two normal distributions, centered at π and 0, the latter with some points wrapping around to values below 2π. Optimal blocks are depicted with thick horizontal bars superimposed on ordinary histograms. Top: block representation on the interval [0, 2π]. Bottom: block representation of three concatenated copies of the same data on [0, 6π]. Vertical dotted lines at 2π and 4π indicate boundaries between the copies. The blocks in the central copy, between these lines, are not influenced by end effects and are the correct optimal representation of these circular data.
Other Images in This Article

Show More
Copyright and Terms & Conditions
© 2013. The American Astronomical Society. All rights reserved.