Image Details
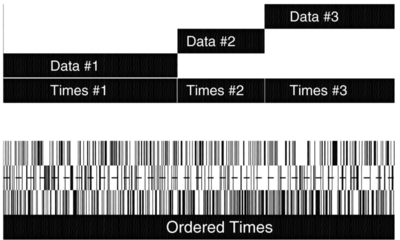
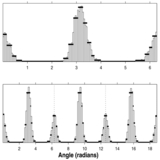
Caption: Figure 2.
Schematic depicting an example of how three data series are first concatenated into a matrix (top) and then redistributed by ordering the combined time tags (bottom). The cost functions for the series can then be computed from the data in horizontal slices (e.g., dashed line) and combined, allowing the change points to be at any of the time tags.
Other Images in This Article

Show More
Copyright and Terms & Conditions
© 2013. The American Astronomical Society. All rights reserved.
Copyright ©
2025 Astronomy Image Explorer. All Rights Reserved.