Image Details
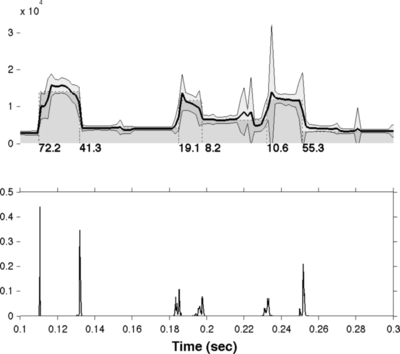
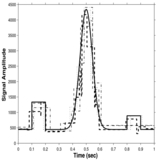
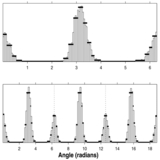
Caption: Figure 8.
Error analysis for the data in Channel 4 from Figure 7, zooming in on the time interval with most of the activity. Top: heavy solid line is bootstrap mean (256 realizations), with thin lines giving the ±1σ rms deviations, all superimposed on the BB representation. Bottom: approximate posterior distribution functions for the locations of the change points, obtained by fixing all of the others.
Other Images in This Article

Show More
Copyright and Terms & Conditions
© 2013. The American Astronomical Society. All rights reserved.
Copyright ©
2025 Astronomy Image Explorer. All Rights Reserved.