Image Details
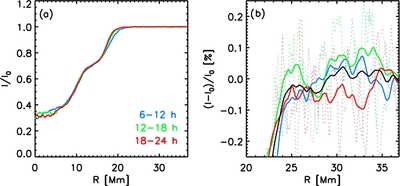
Caption: Figure 11.
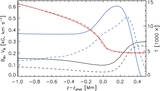
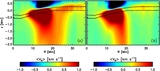
Temporal averages of the azimuthally averaged intensity for the sunspot presented in Figure 10. Panel (a) shows the intensity profile from the center of the spot to the edge of the moat region. Panel (b) presents fluctuation around the mean intensity in the moat region. Dotted lines indicate the fluctuations present in 6 hr azimuthal averages. Solid lines are in addition averaged with a 2.5 Mm window in the radial direction to highlight potential trends of intensity with radius. The black line shows the average from 6 to 24 hr.
Other Images in This Article
Show More
Copyright and Terms & Conditions
© 2011. The American Astronomical Society. All rights reserved.
Copyright ©
2026 Astronomy Image Explorer. All Rights Reserved.