Image Details
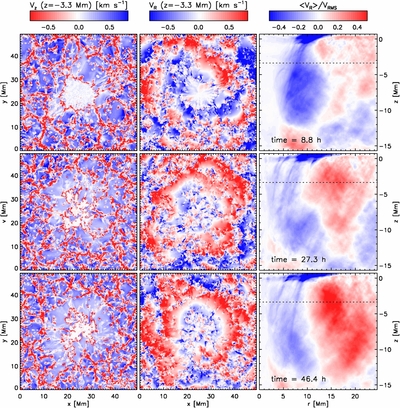
Caption: Figure 2.
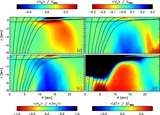
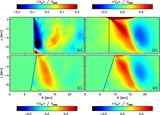
Evolution of large-scale flows shown for the same snapshots presented in Figure 1. The left column presents vertical velocity at a depth of z = −3.3 Mm; blue colors indicate upflows. The middle column presents radial flow velocity at a depth of z = −3.3 Mm; red colors indicate outflows. The right column presents azimuthal averages of the radial flow velocity, normalized by the convective rms velocity. The dotted horizontal line indicates the depth level of z = −3.3 Mm used in the left and middle columns. Convection cells arrange in a ring-like fashion around the sunspot. As a consequence, horizontal convective flows lead to a mean flow reaching about 50% of the convective rms velocity during the later stages of the simulation.
Other Images in This Article
Show More
Copyright and Terms & Conditions
© 2011. The American Astronomical Society. All rights reserved.