Image Details
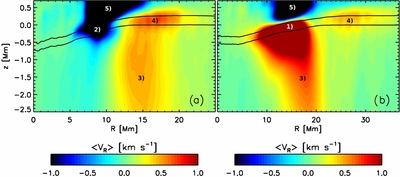
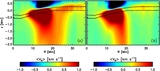
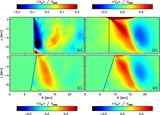
Caption: Figure 6.
Comparison of the radial flow amplitudes in the uppermost 3 Mm of the domain. Panel (a) corresponds to the simulation presented in Figure 4, panel (b) to Figure 5. In contrast to Figures 4 and 5 the velocity is not normalized by the rms velocity. Also note the different horizontal scales and resulting aspect ratio in both panels. The two dark lines indicate the τ = 1 and τ = 0.01 levels in both panels. In both cases the flow amplitudes of the outflows surrounding the sunspots peak above τ = 1, typical flow velocities are about 600 m s −1 for the case without penumbra and 400 m s −1 for the case with penumbra. The numbers indicate flow components that are discussed further in the text.
Other Images in This Article
Show More
Copyright and Terms & Conditions
© 2011. The American Astronomical Society. All rights reserved.