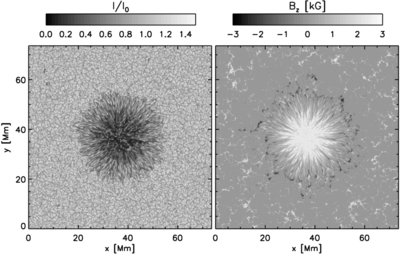
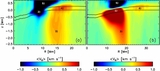
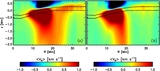
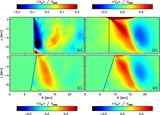
Intensity image and magnetogram of the sunspot with penumbra for which we present the subsurface flow structure in Figures
5,
6, and
8; long-term averages of the photospheric brightness are presented in Figure
11. Intensity and magnetic field after running the simulation for 24 hr are shown.