Image Details
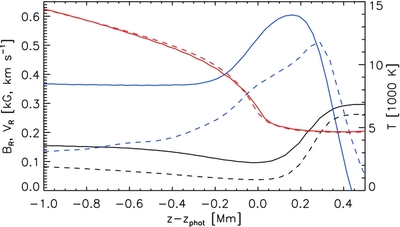
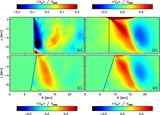
Caption: Figure 7.
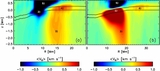
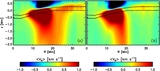
Vertical profiles of the radial magnetic field strength (black), radial flow velocity (blue), and temperature (red). Solid lines show averages in between R = 13 and R = 20 Mm in Figure 6(a), dashed lines show averages in between R = 23 and R = 28 Mm in Figure 6(b). The fastest outflow velocities are found about 200 km above the τ = 1 level, where the radial magnetic field strength increases and forms a magnetic canopy overlying the plage region surrounding the sunspots.
Other Images in This Article
Show More
Copyright and Terms & Conditions
© 2011. The American Astronomical Society. All rights reserved.
Copyright ©
2026 Astronomy Image Explorer. All Rights Reserved.