Image Details
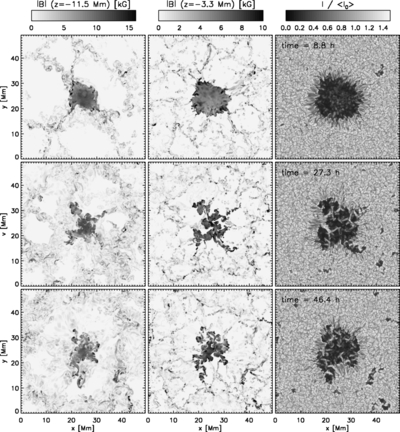
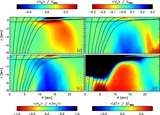
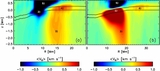
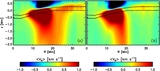
Caption: Figure 1.
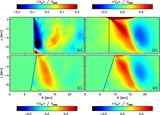
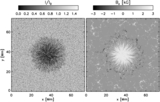
Temporal evolution of subsurface magnetic field strength at two depth levels (left column: z = −11.5 Mm, middle column: z = −3.3 Mm) and surface appearance of sunspot (right column: intensity). Top to bottom snapshots at t = 8.8 hr, t = 27.3 hr, and t = 46.4 hr are shown. The magnetic field is swept into a downflow vertex of the subsurface convection pattern. A fraction of the initial magnetic flux is separating from the main trunk along downflow lanes. At the surface the separation of flux is accompanied with the formation of light bridges and pores surrounding the spot at later stages.
(An animation of this figure is available in the online journal.)
Other Images in This Article
Show More
Copyright and Terms & Conditions
© 2011. The American Astronomical Society. All rights reserved.