

Image Details
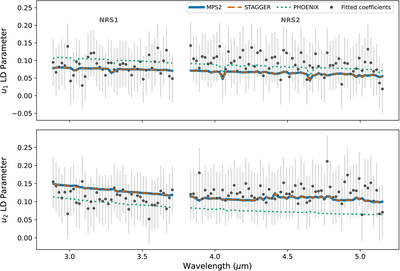
Caption: Figure A2.
Comparison of wavelength-dependent quadratic limb-darkening coefficients (u1, top; u2, bottom) predicted by the ExoTiC-LD MPS2, Stagger, and PHOENIX stellar atmosphere grids and obtained from model-independent fits to the Eureka! reduction for the NRS1 and NRS2 channels. Solid blue, dashed orange, and dotted green curves show the MPS2, Stagger, and PHOENIX predictions, respectively, while gray circles with error bars show the independently fitted limb-darkening coefficients. For the revised analysis, u1 and u2 are fitted freely in each wavelength channel using uniform priors, ﹩{ \mathcal U }(0,1)﹩, with both coefficients initialized at u1 = u2 = 0.2. None of the stellar atmosphere grids is used to initialize, center, or constrain the fitted coefficients; the model curves are shown only as post hoc comparisons to the same freely fitted values. Across the full ∼2.7–5.3 μm wavelength range, MPS2 yields reduced ﹩{\chi }_{\nu }^{2}﹩ values of 1.44 and 1.08 for u1 and u2, respectively, corresponding to a mean value of 1.26. Stagger provides nearly identical agreement, with values of 1.45 and 1.09 and a mean of 1.27, while PHOENIX yields a mean ﹩{\chi }_{\nu }^{2}﹩ of 1.86. MPS2 is therefore preferred as it provides the lowest mean ﹩{\chi }_{\nu }^{2}﹩, although only marginally lower than Stagger. Because the coefficients used in the light-curve analysis are fitted freely, this comparison identifies the grid that most closely reproduces the empirical coefficients but does not bias a particular stellar atmosphere grid.
Other Images in This Article
Copyright and Terms & Conditions
© 2026. The Author(s). Published by the American Astronomical Society.

