

Image Details
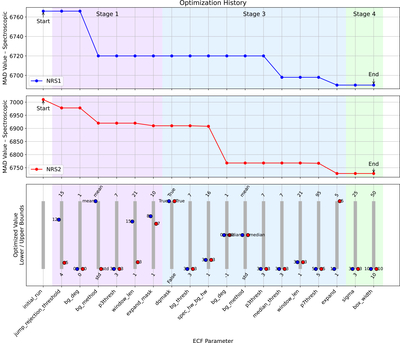
Caption: Figure A1.
Optimization history for the parameter-by-parameter data reduction performed with the Eureka! pipeline. Top and middle panels: evolution of the MAD of the spectroscopic light curves for the NRS1 (blue) and NRS2 (red) detectors as successive reduction parameters are optimized. The MAD values are reported in parts per million. Parameters are varied sequentially, and the value that minimizes the MAD metric is adopted before proceeding to the next step. Shaded regions indicate groups of related optimization stages. The overall decrease in MAD demonstrates progressive improvement in light-curve quality without evidence for instability or over-tuning. Bottom panel: optimized parameter values selected at each step, shown relative to their allowed bounds (gray bars), with blue and red markers denoting the final adopted values for NRS1 and NRS2, respectively. Together, these panels illustrate the process and convergence of the optimization framework used to derive the final Eureka! transmission spectrum.
Other Images in This Article
Copyright and Terms & Conditions
© 2026. The Author(s). Published by the American Astronomical Society.

