

Image Details
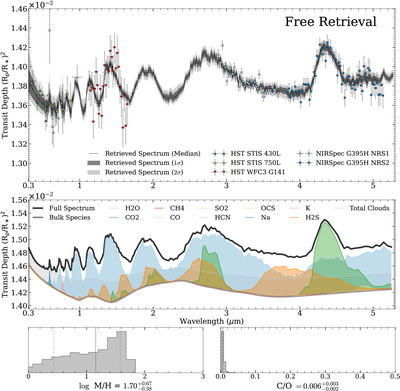
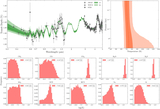
Caption: Figure 3.
Summary of the results from our POSEIDON panchromatic free retrieval. In the upper panel, we show a comparison between the retrieved transmission spectrum and the data used in our analysis. We plot as the black line the median retrieved spectrum and as (dark/light) gray polygons the 1σ and 2σ ranges of the retrieved spectrum. We overplot as colored points with black borders the HST (triangles) and JWST (circles) data points, differentiating between data from HST STIS (blue, upward-facing) and HST WFC3 (red, downward-facing) by the direction of the triangle as well as the color. We apply separate offsets between the JWST NIRSpec G395H Eureka! reduction presented in this work and archival HST STIS and HST WFC3 data, with data from each instrument grouped together. In the middle panel, we show the spectral contribution corresponding to our median retrieved atmosphere, and we include beneath these panels the computed posteriors for the atmospheric metallicity and C/O ratio. For each free-retrieval posterior sample, C/O is calculated by stoichiometrically summing the carbon and oxygen atoms contained in the retrieved C- and O-bearing species. The metallicity M/H is calculated as the ratio between the weighted average of the atmosphere’s stoichiometric C/H, O/H, N/H, P/H, and S/H ratios and their respective M. Asplund et al. (2021) for solar values. These derived quantities are informative summaries rather than independently retrieved parameters. Owing to the high H2O VMR, several orders of magnitude higher than any other carbon- or oxygen-containing molecule, the computed metallicity is quite high while the C/O ratio is very low. Due to the lack of a CO or CH4 detection, these values have little physical meaning. We discuss the molecular detection significance and nested model comparisons related to this free retrieval in Section 3.1 and summarize them in Table 2.
Other Images in This Article
Copyright and Terms & Conditions
© 2026. The Author(s). Published by the American Astronomical Society.

