

Image Details
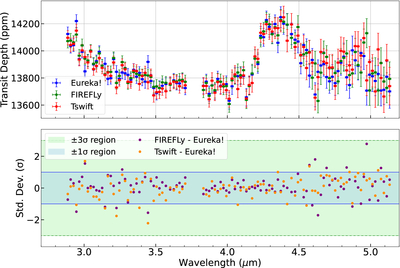
Caption: Figure 2.
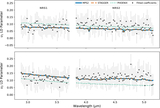
Comparison of the NIRSpec G395H transmission spectra derived using the Eureka!, FIREFLy, and Tswift reduction pipelines. Top panel: transit depth (ppm) as a function of wavelength for each reduction, shown with 1σ uncertainties. The three independently reduced spectra show excellent agreement in absolute transit depth and spectral structure across the full NRS1 and NRS2 wavelength range, with overlapping error bars for the vast majority of channels. Bottom panel: standardized residuals relative to Eureka!, shown for FIREFLy−Eureka! (purple) and Tswift−Eureka! (orange). The shaded regions indicate the ±1σ (blue) and ±3σ (green) intervals. Most spectral bins lie within ±1σ, and nearly all fall within ±3σ, with no evidence for systematic wavelength-dependent offsets, demonstrating strong cross-pipeline consistency and robust reproducibility of the G395H transmission spectrum.
(The data used to create this figure are available in the online article.)
(The data used to create this figure are available.)
Other Images in This Article
Copyright and Terms & Conditions
© 2026. The Author(s). Published by the American Astronomical Society.

