

Image Details
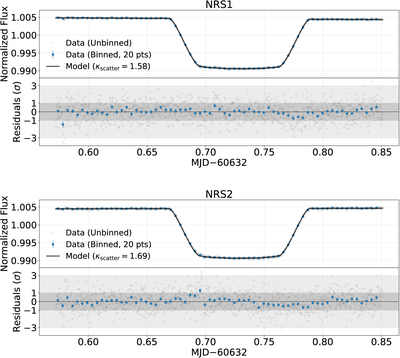
Caption: Figure 1.
G395H white-light transit fits for the two NIRSpec detectors, NRS1 (top) and NRS2 (bottom), derived from data reduced with the Eureka! pipeline. In each panel, the upper subpanel shows the normalized flux time series, with unbinned data shown as gray points and time-binned data (20 points per bin) shown as blue points with uncertainties. Time is shown along the x-axis in MJD − 60632, where MJD = BJD − 2400000.5. The best-fitting transit model is overplotted as a solid black curve. The corresponding residuals, expressed in units of the photometric uncertainty (σ), are shown in the lower subpanels, with the shaded region indicating ±1σ. The fitted scatter inflation factors (κscatter) are reported in each panel legend as metrics for the transit model’s fit to the Eureka! light-curve data, demonstrating statistically consistent fits for both detectors.
Other Images in This Article
Copyright and Terms & Conditions
© 2026. The Author(s). Published by the American Astronomical Society.

