

Image Details
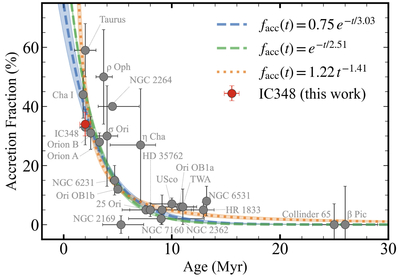
Caption: Figure 9.
Accretion fraction as a function of age for nearby young clusters and associations; the IC 348 measurement is highlighted in red. Relative to the compilation of D. Fedele et al. (2010), we update the adopted age constraints where newer measurements are available (see Table 2) and add one additional cluster, NGC 2264. The dashed curves show the exponential decay fits. The blue curve corresponds to ﹩{f}_{{\rm{acc}}}(t)={e}^{-t/{\tau }_{{\rm{acc}}}}﹩, with ﹩{\tau }_{{\rm{acc}}}=2.5{2}_{-0.11}^{+0.11}\,{\rm{Myr}}﹩, while the green curve corresponds to ﹩{f}_{{\rm{acc}}}(t)=C\,{e}^{-t/{\tau }_{{\rm{acc}}}}﹩, with ﹩C=0.7{4}_{-0.10}^{+0.12}﹩ and ﹩{\tau }_{{\rm{acc}}}=3.0{6}_{-0.33}^{+0.37}\,{\rm{Myr}}﹩. The orange curve corresponds to the power-law model facc(t) = ktα, with ﹩k=1.2{2}_{-0.22}^{+0.30}﹩ and ﹩\alpha =-1.4{1}_{-0.15}^{+0.13}﹩.
Other Images in This Article
Show More
Copyright and Terms & Conditions
© 2026. The Author(s). Published by the American Astronomical Society.

