

Image Details
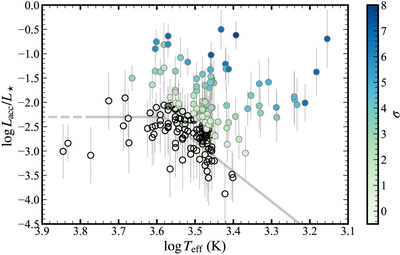
Caption: Figure 6.
Accretion-to-stellar luminosity ratio versus effective temperature, color-coded by standard deviation (σ) from the Lacc/L⋆−Teff boundary. The gray line represents the threshold where chromospheric emission is expected to dominate over accretion-related Hα emission (C. F. Manara et al. 2017a). The sample of nonaccreting pre-main-sequence stars from C. F. Manara et al. (2017a) is limited to Teff of less than 5800 K; therefore, we represent the region outside this limit as a gray dashed line. Black open circles represent objects below or consistent with this boundary at the <1σ level.
Other Images in This Article
Show More
Copyright and Terms & Conditions
© 2026. The Author(s). Published by the American Astronomical Society.

Copyright ©
2026 Astronomy Image Explorer. All Rights Reserved.
