

Image Details
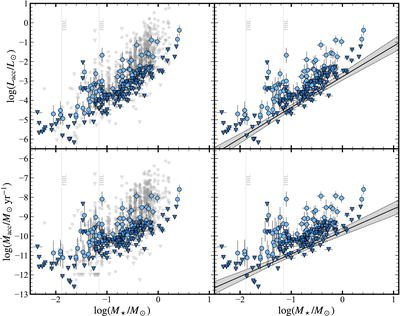
Caption: Figure 7.
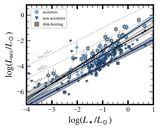
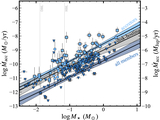
Correlation between stellar mass and accretion properties for the 200 members of IC 348 in this study. The top panels illustrate the relationship between accretion luminosity (Lacc) and stellar mass (M⋆), with measurements for IC 348 from this study displayed in blue and the CASPAR dataset values in gray. For the CASPAR sample, binaries are included; mean mass and accretion rates are used when multiple measurements/epochs are present. Darker blue triangles indicate upper limits for nondetections. The bottom panels present the mass accretion rate (﹩{\dot{M}}_{\mathrm{acc}}﹩) as a function of stellar mass. The solid lines in the right panels represent a linear regression fit (corresponding to a power law in linear space) following the Bayesian framework described in B. C. Kelly (2007), which accounts for errors in both mass and accretion luminosity (or mass accretion rate for the bottom right panel) as well as nondetections. The shaded area denotes the 1σ confidence interval.
Other Images in This Article
Show More
Copyright and Terms & Conditions
© 2026. The Author(s). Published by the American Astronomical Society.

